A Bar-by-Bar Assessment of the Current Market
In the midst of all the domestic and geopolitical noise, a bar-by-bar assessment of the current market indicates a pullback is likely. I certainly did not want to go home long on Friday night. But it wasn’t all because of the US – Iran conflict or impeachment. It’s also what the charts are telling me.
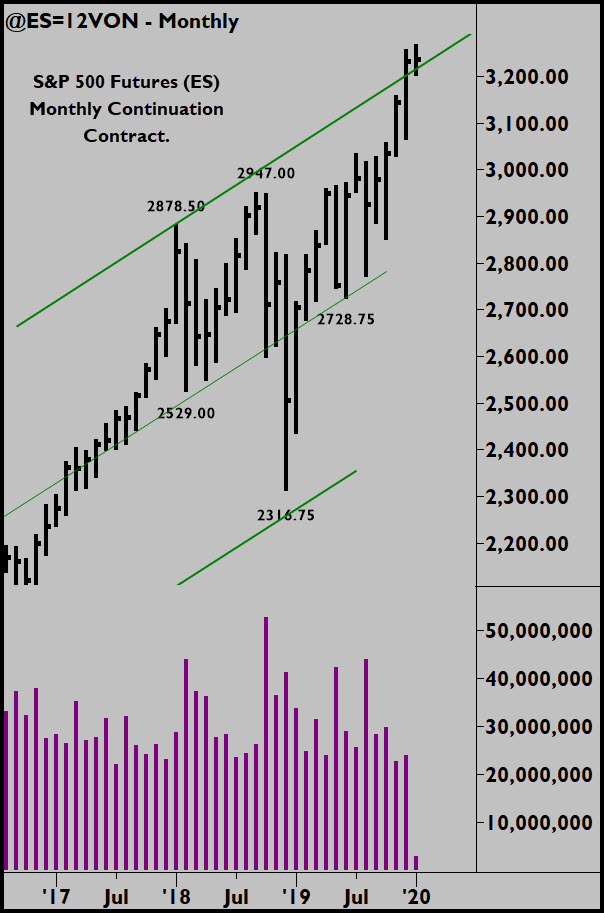 A bar-by-bar assessment of the current market sees the monthly chart in overbought territory. The monthly chart shows price just above the supply line. The “supply line” is the term we use for the upper line in the trend channel. We expect selling or supply to come in around this area, hence supply line. However you might describe it, the monthly is overextended to the upside.
In our bar-by-bar assessment of the current market, if the monthly is overbought, then we should start to see weakness emerge on the lower time frames, such as the weekly and daily charts. Let’s turn to the weekly chart.
A Bar-by-Bar Assessment of the Current Market: Weekly Chart
The weekly has been in a strong trend up since the lows of last summer and fall. We saw sustained volume nearly all the way up, supporting that trend. And, now, last week’s price action puts the market near the top of the weekly trend channel.
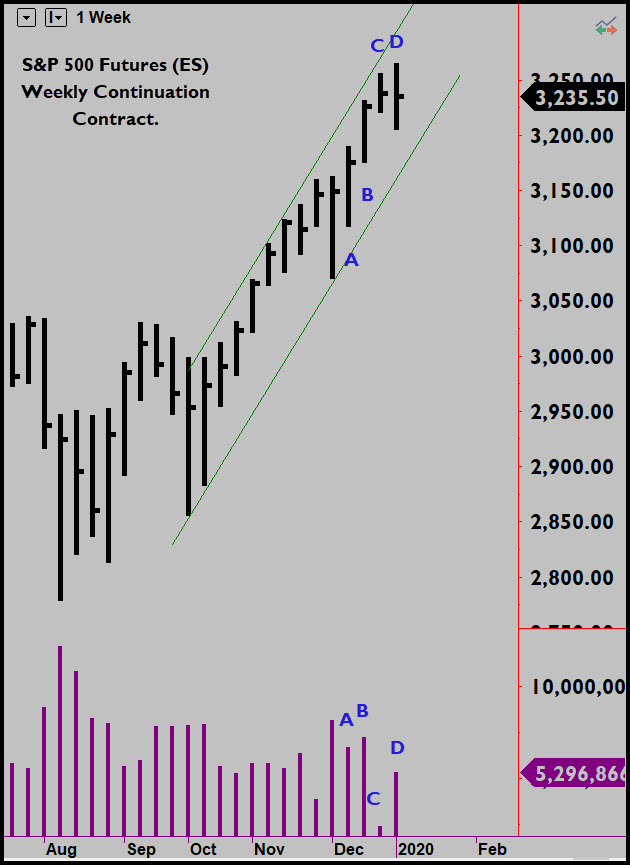 Leading up to the current price level, the weekly moved nicely up on bars A and B after a brief pullback. Note the firm closes and strong volume consistent with the price action. The market moves higher the next week (bar C), but I notice three potentially important things. First, the volume became significantly low. Yes, I know it’s the holidays. It doesn’t matter. Low volume is low volume. We’ll come back to this in a moment. In addition to the low, low volume, the range has narrowed considerably. This is the second observation: it’s the smallest weekly range and lightest weekly volume since the lows of August.
The third observation is that bar C closes in the middle. Buyers couldn’t hold the highs like they did every week for the last four weeks. Taken together, these three observations indicate little demand at the highs at the top of the weekly trend channel. The buyers appear to be getting tired. Are they no longer willing to chase price up?
Last week’s bar (bar D) says they are not. On bar D, we see volume returns to near average levels. This means trading activity returned to about normal after the holidays. Was further progress made on the increased activity? No. The week closed essentially level with the prior week’s close, showing no net new progress. And it did so on decent volume. Whatever buyers were active last week, they were kept in check by sellers. Had the increased volume been dominated by buying, we would have seen price action like bars A and B. Instead, it’s a level bar. This confirms the low, low volume and narrow range seen last week (bar C) as being valid no demand, despite it being a holiday week.
A Bar-by-Bar Assessment of the Current Market: Daily Chart
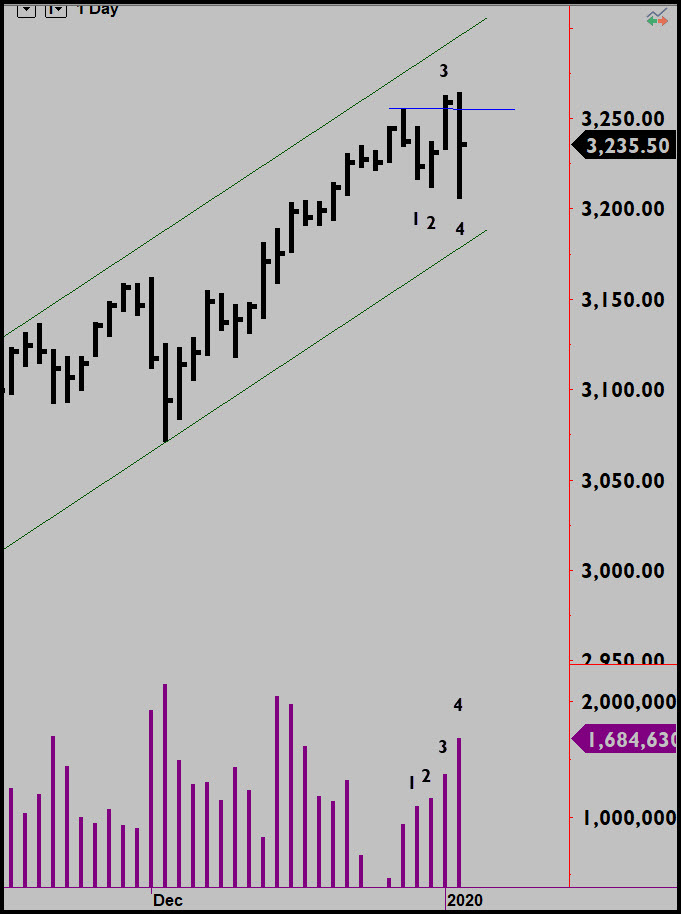 We see this play out on the daily chart. You can see how the daily meandered on the light volume of the prior week. Last week, the market pulled back slightly early in the week (days 1 & 2), then started up again on bar 3. Volume picks up and although it closes firm, it doesn’t close much above the prior week’s high. There was good effort to break out and away from recent resistance, it just didn’t get very far. Bar 4 tells why. Sellers clearly stepped in. We see good volume and no progress. In fact, the close of bar 4 is on yesterday’s lows. What happened to the buyers?
The market may still try to go higher next week, but the near-term upside appears limited to about the 3275 area. A close above last week’s highs would put the market in position to rally further. I don’t anticipate a lot of downside at this point. A pullback into the lower trend line just below 3200 (about 3190) would be an initial expectation, if the market heads lower. A break of this level would encourage the market to trade down to about 3150.
If you are interested in reading the market bar-by-bar like this, you might check out our weekly Deep Practice program. We do this each week with a great group of traders from across the globe. You can quickly learn classic “tape reading” skills like this. Check it out here: Dr Gary’s Deep Practice

Leave a Reply